9.14 矩阵
矩阵(Matrix)是一个按照长方阵列排列的复数或实数集合。向量是一维的,而矩阵是二维的,需要有行和列。矩阵是R语言中使用较多的一种数据结构,矩阵分为数值矩阵和字符串矩阵,常用的是数据矩阵,基因的表达数据为数值矩阵。矩阵有两大作用,一个是用来计算相关性,另外可以用来绘制热图。
1 创建矩阵
state.x77
m <- matrix(1:20,nrow = 4,ncol = 5)
rowSums(state.x77)
colMeans(state.x77)
cor(state.x77)
2 矩阵索引
矩阵属于二位数据,需要给定行列的。
state.x77
state.x77[1,2]
state.x77[1,]
state.x77["Alabama",]
rownames(state.x77)
colnames(state.x77)
3 利用矩阵绘制热图
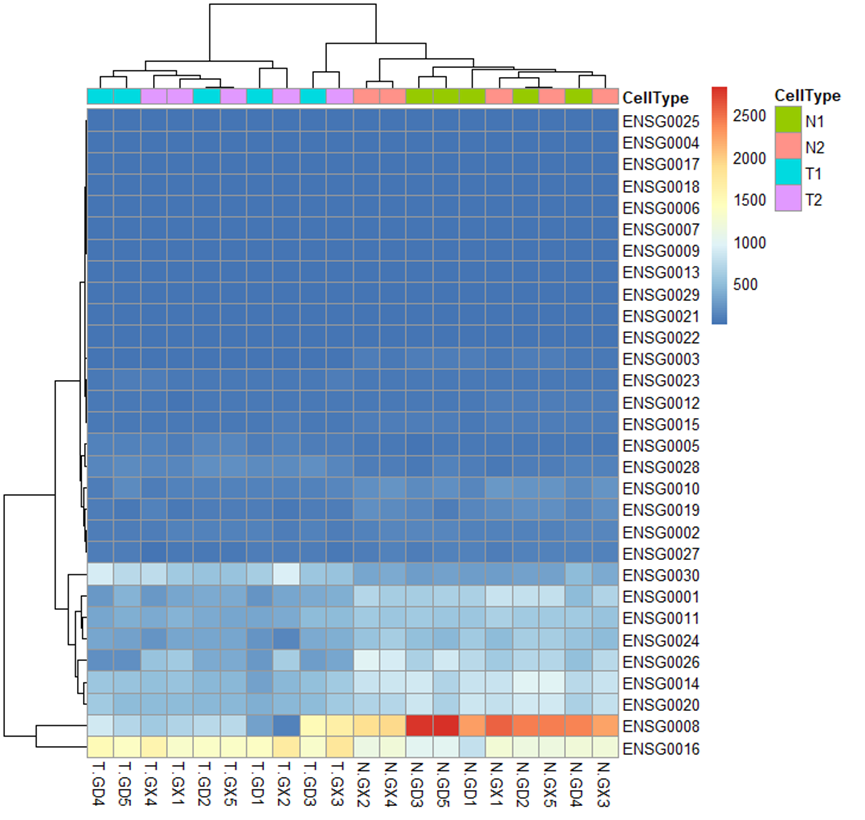
图 1利用pheatmap绘制热图
R非常擅长绘制热图,基础包中的heatmap()可以直接绘制热图,gplots 包 heatmap.2()也可以绘制热图,pheatmap包 pheatmap()函数可以绘制更加优雅的热图,ComplexHeatmap包可以绘制复杂的热图。
# 利用pheatmap绘制热图
#install.packages("pheatmap")
library(pheatmap)
x <- read.csv("Rdata/heatmap.csv",header = T,row.names = 1)
class(x)
pheatmap(x)
annotation_col <- data.frame(CellType=factor(rep(c("N1","T1","N2","T2"),each=5)))
rownames(annotation_col) <- colnames(x)
pheatmap(x,annotation_col = annotation_col)
pheatmap(x,annotation_col = annotation_col,display_numbers = T)
pheatmap(x,annotation_col = annotation_col,display_numbers = T,number_format = "%.2f")
pheatmap(x,annotation_col = annotation_col,display_numbers = T,number_format = "%.1f",number_color = "black")
4 分组条形图
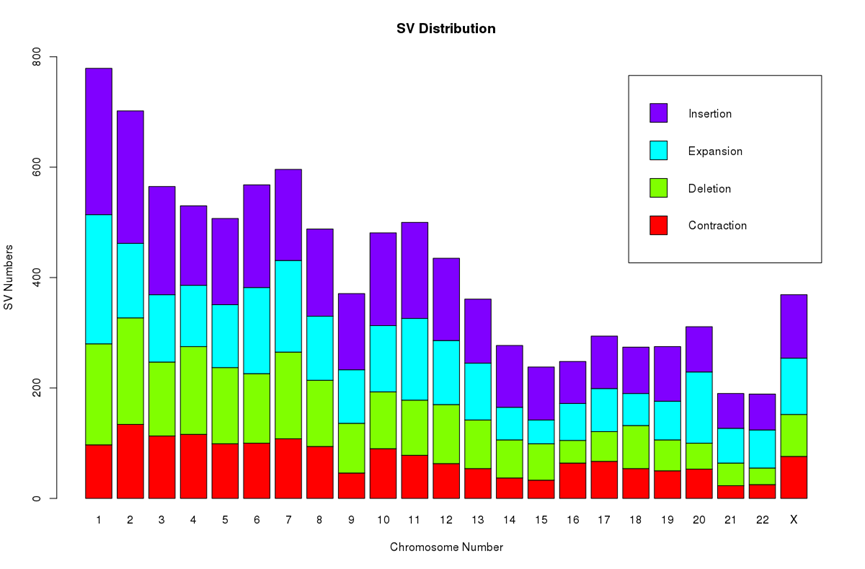
图 2堆叠条形图
x <- read.csv("Rdata/sv_distrubution.csv",header = T,row.names = 1)
x
barplot(x)
barplot(as.matrix(x))
barplot(t(as.matrix(x)))
barplot(t(as.matrix(x)),col = rainbow(4))
barplot(t(as.matrix(x)),col = rainbow(4),beside = T)
barplot(t(as.matrix(x)),col = rainbow(4),legend.text = colnames(x))
barplot(t(as.matrix(x)),col = rainbow(4),legend.text = colnames(x),ylim = c(0,800))
barplot(t(as.matrix(x)),col = rainbow(4),legend.text = colnames(x),ylim = c(0,800),  main = "SV Distribution",xlab="Chromosome Number",ylab="SV Numbers")